The Difference Between Monitoring and Observability
Your application goes down at 3 AM. An alert fires. Your on-call engineer wakes up. They log into the monitoring dashboard and see: CPU is high. Memory is high. Disk is full.
But they still don't know why. They SSH into the server. They check logs. They grep for errors. Nothing obvious. They restart the application. It comes back up. Mystery solved? No — it will happen again because the root cause is invisible.
This is the difference between monitoring and observability. Monitoring tells you that something broke. Observability tells you why it broke and how to fix it before it happens again.
Monitoring is what you do when you know what to look for. Observability is what you need when you don't.
Why Monitoring Alone Isn't Enough
Traditional monitoring works fine for simple systems. You have a server. You monitor CPU, memory, disk, network. If any metric exceeds a threshold, an alert fires. Simple.
But modern systems are distributed. You have microservices calling each other across regions. You have containers that spawn and die. You have databases replicated across zones. You have message queues and caches and CDNs. The systems are so complex that you can't predefined every possible failure mode.
Monitoring breaks down because:
- You don't know what to monitor. Traditional metrics (CPU, memory) don't explain business impact. A 10% CPU increase might be normal. Or it might indicate a memory leak that will crash the system in 8 hours.
- Alerts become noise. You set thresholds. False positives multiply. Your team stops trusting alerts. Real problems slip through.
- Root cause analysis takes hours. When a service is slow, you need to know: which requests are slow? Which dependency is the bottleneck? Is it a database query? A downstream API call? Network latency? Without detailed observability data, you're guessing.
- You can't reproduce issues in production. A customer reports a bug that happens inconsistently. It doesn't reproduce in staging. Without seeing the actual request, the actual data, the actual timing, you're helpless.
Observability solves this. Instead of predefining what to monitor, you collect all signals from your system—metrics, logs, traces—and explore freely when problems occur.
The Three Pillars of Observability
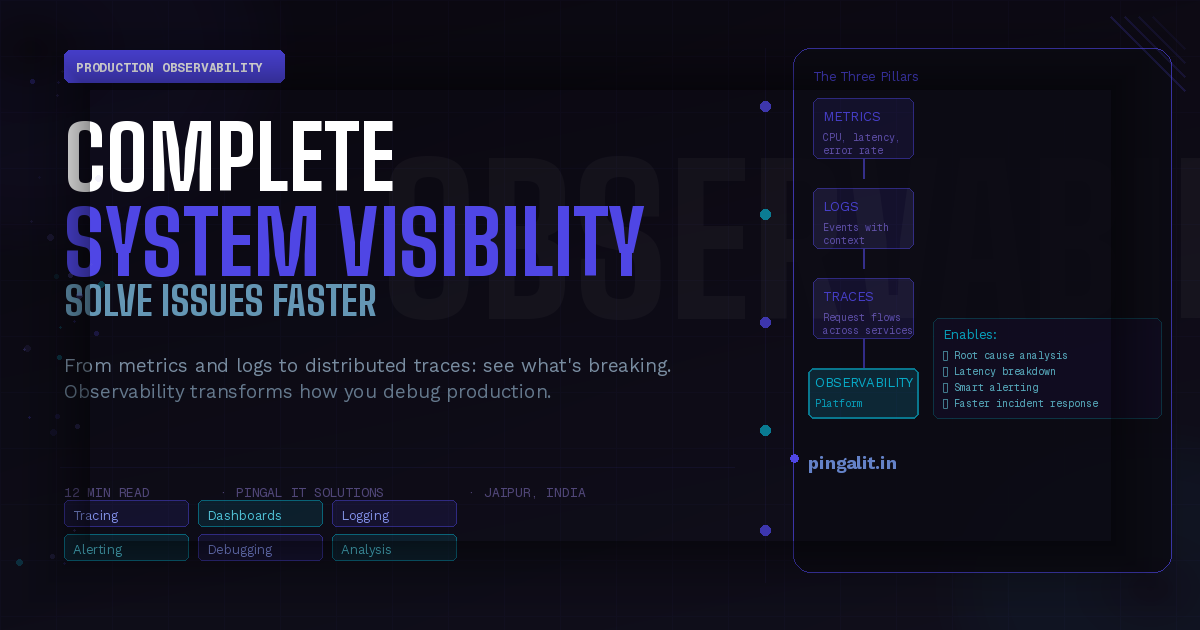
Observability rests on three types of data: metrics, logs, and traces. Together, they give you complete visibility into system behavior.
1. Metrics — Aggregated, Time-Series Data
Numbers that change over time. Request latency, error rate, CPU usage, database connection count, cache hit ratio. Metrics are lightweight and designed for long-term retention and alerting.
Example: "P99 latency (99th percentile) for the payment API is 450ms right now; it's normally 50ms."
Tools: Prometheus, Datadog, New Relic, CloudWatch
2. Logs — Discrete Events with Context
Textual records of what happened. "User logged in", "Database query took 120ms", "Cache miss", "Error: connection refused". Logs provide context but are expensive to store long-term.
Example: A request ID. Every service that touches that request logs it with that ID. You can trace the request end-to-end.
Tools: ELK (Elasticsearch, Logstash, Kibana), Splunk, Datadog, Loki
3. Traces — Request Flows Across Services
A distributed trace follows one request through your entire system. Request comes in → Service A processes it → calls Service B → Service B queries database → calls Service C → response sent back. Each hop is timed and annotated with errors or warnings.
Example: A customer's checkout takes 8 seconds. A trace shows: 2 seconds waiting for payment API (that's the bottleneck), 3 seconds for inventory check, 2 seconds for shipping calculation, 1 second for database writes. Now you know where to optimize.
Tools: Jaeger, Zipkin, Datadog, New Relic, Honeycomb
| Pillar | Data Type | Use Case | Scale | Cost |
|---|---|---|---|---|
| Metrics | Time-series numbers (CPU%, latency, errors) | Alerting, dashboards, trends | Stores years of data | Low |
| Logs | Structured/unstructured text events | Debugging, investigation, audit | Stores days to weeks | Medium to High |
| Traces | Request flows with timing and spans | Latency analysis, bottleneck identification | Stores hours to days | High (unless sampled) |
Building Observability Into Your System
Step 1: Instrument Your Code
Add observability libraries to your application. These libraries auto-capture metrics, logs, and traces with minimal code.
- For Node.js: OpenTelemetry + Datadog, Elastic APM
- For Python: OpenTelemetry + auto-instrumentation
- For Java: OpenTelemetry, New Relic, Datadog agents
- For Go: OpenTelemetry + Jaeger or Datadog
Modern instrumentation is powerful: it auto-traces database queries, HTTP calls, and message queue operations. You don't have to manually instrument every operation.
Step 2: Aggregate Into a Centralized System
Your application is sending metrics, logs, and traces. You need a system to collect, store, and query all of it. Options:
- Commercial (easier): Datadog, New Relic, Honeycomb, Elastic Cloud
- Open-source (cheaper but more ops): Prometheus + Grafana + Loki + Jaeger
- Hybrid: Run your own infrastructure for metrics; use managed service for traces
For most teams, a managed observability platform is worth the cost. It removes the operational burden of running log storage, metrics databases, and trace indexing.
Step 3: Build Dashboards for Your Workflows
Create dashboards that reflect how you think about your system:
- Business dashboards: Transactions per minute, revenue, conversion rate, error rate
- Service dashboards: One per critical service. Latency, error rate, throughput, dependencies
- Infrastructure dashboards: CPU, memory, disk, network per host or container
- On-call dashboards: Quick overview of all critical metrics for whoever is on call
Good dashboards are not comprehensive. They show what matters right now. They fit on one screen. They highlight anomalies.
Step 4: Set Up Alerting — Smart, Not Noisy
Alert on outcomes, not metrics. Instead of alerting when CPU is above 80%, alert when error rate has doubled or latency is above your SLO.
- Alert on: Error rate rising, latency above SLO, business metrics declining
- Don't alert on: CPU above 80%, disk usage above 60%, connection count high
One alert per incident. Don't send 10 alerts for the same problem. Use alert grouping and correlation.
Step 5: Train on Post-Incident Review Workflow
When something breaks, your team should:
- Get paged (alert fires)
- Check dashboard (status page, on-call dashboard)
- If obvious, fix it
- If not obvious, use traces to find the bottleneck
- Dig into logs for that service/request ID
- Post-incident, create a dashboard to catch this earlier next time
This workflow becomes faster as you practice it. The first incident might take 2 hours. By the 10th, it's 15 minutes.
Observability for Different System Architectures
Monoliths
Monoliths have fewer moving parts. Observability is still useful but simpler. Focus on request tracing within the application, database query analysis, and external API calls.
Microservices
Microservices are where observability shines. A single user action might touch 10 services. Without traces, you have no way to correlate logs across services or understand latency breakdown. Distributed tracing is essential.
Serverless/FaaS
Serverless functions are ephemeral and auto-scaling. Traditional monitoring struggles. Structured logging and automated tracing (via AWS X-Ray, DataDog, Honeycomb) are critical.
Containerized/Kubernetes
Containers spawn and die constantly. Traditional host-based monitoring is useless. You need container-aware metrics (which containers are running, which pods are throttled) and correlation between container restarts and application errors.
How Pingal IT Solutions Implements Observability
When building production systems for clients, observability is built in from day one, not added later. This means:
- Instrumentation in code: Every service includes OpenTelemetry or equivalent instrumentation
- Centralized platform: Logs, metrics, and traces flow to a managed observability platform
- Service-level dashboards: Each service has a dashboard showing latency, error rate, and dependencies
- Alerting on outcomes: Alerts on error rate and latency, not infrastructure metrics
- Runbook documentation: When an alert fires, on-call has a clear playbook for investigation
For teams running complex, distributed systems, Pingal IT's Cloud and DevOps services include observability architecture design and implementation. We help you instrument applications, choose the right observability platform, and build the dashboards and alerting that actually catch real problems.
Observability Checklist
- ✅ All services are instrumented with tracing (OpenTelemetry or equivalent)
- ✅ Metrics are being collected and stored (Prometheus, Datadog, etc.)
- ✅ Structured logging is in place (JSON logs with request IDs)
- ✅ Logs, metrics, and traces are flowing to a centralized system
- ✅ Service-level dashboards exist for all critical services
- ✅ On-call dashboard exists and is used at incident start
- ✅ Alerts are configured on business outcomes (error rate, latency)
- ✅ Alert noise is low (< 1 false positive per week)
- ✅ Distributed traces are queryable by request ID
- ✅ Post-incident reviews include observability findings (what we would have seen if we'd looked here)
- ✅ Runbooks exist for critical alerts
FAQs
Isn't observability just more complex monitoring?
No. Monitoring is prescriptive—you define metrics and thresholds in advance. Observability is exploratory—you collect signals and explore freely when problems occur. Monitoring breaks down in complex systems where you can't predict all failure modes. Observability handles complexity by letting you ask questions of your data after the fact.
Do we need all three pillars (metrics, logs, traces)?
Yes. Metrics alone tell you something is wrong, but not why. Logs give you context but are too verbose to alert on. Traces show you request flows but are expensive to retain long-term. Together, they give complete visibility. Start with one pillar; build toward all three.
Can we use open-source tools instead of a managed service?
Yes, but be aware of the tradeoff. Open-source (Prometheus, Loki, Jaeger) is cheaper but requires operational overhead: running the systems, maintaining storage, scaling as data grows. For most teams under 50 engineers, a managed service is worth the cost in saved time. Larger teams often run hybrid setups (open-source for some pillars, managed for others).
How do we handle the cost of tracing all requests?
Sampling. Trace every request in development and staging; sample 10% or 1% in production. Smart sampling tools (like Honeycomb's dynamic sampling) trace more aggressively when error rates are high. Start with 100% sampling; reduce as volume grows and costs rise.
What if we don't have microservices yet?
Observability still helps. You can trace requests within a monolith, see which functions are slow, which database queries are expensive. Traces are most powerful in distributed systems, but observability practices apply everywhere.
How do we onboard the team?
Start with dashboards. Show the team the business dashboard (transactions, errors, latency) and the service dashboards. Let them explore. When an incident occurs, teach them to use traces to find the bottleneck. Observability is learned through practice, not training.
Should observability be a team responsibility or specialist role?
Both. One person owns the observability architecture (choosing tools, setting up centralized logging, designing dashboards). But every engineer should know how to use traces and logs to debug. Observability is too important to be siloed.
When should we invest in observability?
Now. Don't wait until you have 10 microservices and can't debug production. Observability built into the first service saves pain when you have 50 services. The earlier you start, the better your data and habits when things get complex.